Getting Started with lehdr
Accessing and Analyzing LODES Data in R
Jamaal Green
Dillon Mahmoudi
Liming Wang
21 August 2026
Source:vignettes/getting_started.Rmd
getting_started.RmdIntroduction
lehdr is an R package that provides programmatic access to the Longitudinal Employer-Household Dynamics (LEHD) Origin-Destination Employment Statistics (LODES) dataset. LODES forms the backbone of the U.S. Census Bureau’s OnTheMap web application, which maps commuting patterns at fine geographic scales. While OnTheMap is a useful exploratory tool, it does not support systematic comparisons over time or across geographies. lehdr fills that gap by exposing LODES downloads as tidy data frames and providing built-in functions for common analyses.
LODES contains three file types:
-
OD (
lodes_type = "od"): Origin-destination flows, giving the number of workers by home-workplace Census block pair. -
RAC (
lodes_type = "rac"): Residential area characteristics, giving job totals at workers’ home blocks. -
WAC (
lodes_type = "wac"): Workplace area characteristics, giving job totals at workers’ job blocks.
Installation
# From CRAN
install.packages("lehdr")

# Development version from GitHub
devtools::install_github("jamgreen/lehdr")

library(lehdr)
library(dplyr)
Basic Usage
Downloading a single state and year
The following example retrieves 2020 Oregon OD data aggregated to the
Census tract level. Only primary jobs (job_type = "JT01")
across all worker segments (segment = "S000") are
included.
or_od <- grab_lodes(
  state      = "or",
  year       = 2020,
  lodes_type = "od",
  job_type   = "JT01",
  segment    = "S000",
  state_part = "main",
  agg_geo    = "tract"
)

head(or_od)
Multiple states and years
Pass character vectors to state and/or numeric vectors
to year. The function returns a single bound tibble across
all combinations.
or_ri_od <- grab_lodes(
  state      = c("or", "ri"),
  year       = c(2019, 2020),
  lodes_type = "od",
  job_type   = "JT01",
  segment    = "S000",
  state_part = "main",
  agg_geo    = "tract"
)

head(or_ri_od)
Not all state-year combinations are available for every LODES version. Consult the LEHD Technical Document for availability.
Aggregation levels
agg_geo controls the output geography. Valid values are
"block" (default), "bg" (block group),
"tract", "county", and "state".
Aggregation truncates GEOID strings and sums all numeric columns.
md_rac_county <- grab_lodes(
  state      = "md",
  year       = 2019,
  lodes_type = "rac",
  job_type   = "JT01",
  segment    = "S000",
  agg_geo    = "county"
)

head(md_rac_county)
Attaching spatial geometries
Set geometry = TRUE to retrieve Census geometries via
the tigris package and attach them to the result. For
lodes_type = "rac" or "wac", the return value
is an sf object. For lodes_type = "od", two
geometry columns (h_geometry, w_geometry) are
added but the object remains a tibble — use sf::st_as_sf()
to promote it.
md_wac_sf <- grab_lodes(
  state      = "md",
  year       = 2019,
  lodes_type = "wac",
  job_type   = "JT01",
  segment    = "S000",
  agg_geo    = "county",
  geometry   = TRUE
)

plot(md_wac_sf["C000"])
Geographic crosswalk
grab_crosswalk() downloads the LODES geographic
crosswalk, which maps Census blocks to all higher-level geographies.
Useful when you need custom aggregations not covered by
agg_geo.
vt_xwalk <- grab_crosswalk("vt")

# LODES7 vintage crosswalk (2010 Census blocks)
vt_xwalk_7 <- grab_crosswalk("vt", version = "LODES7")
Analytical Functions
lehdr includes three functions for common LODES analyses. All examples below use Maryland, which has a rich and varied labor market geography: a large central city (Baltimore), dense inner suburbs, agricultural Eastern Shore counties, and strong federal-sector employment in the Washington suburbs.
Commute flow statistics
compute_commute_stats() summarizes commute flows from an
OD dataset into per-geography metrics: workers arriving (inflow),
workers departing (outflow), internal flows, net flow, and the
self-containment ratio. Self-containment is the share of employed
residents who also work within the same geographic unit — a value close
to 1 indicates a largely self-sufficient labor market, while values near
0 indicate heavy out-commuting.
od_md <- grab_lodes(
  state      = "md",
  year       = 2019,
  lodes_type = "od",
  job_type   = "JT00",
  segment    = "S000",
  state_part = "main",
  agg_geo    = "county"
)

commute_md <- compute_commute_stats(od_md, agg_geo = "county")

# Most self-contained counties
commute_md %>%
  arrange(desc(self_containment)) %>%
  select(county, workers_in, workers_out, net_flow, self_containment) %>%
  head(10)
Net flow identifies counties that are net job importers (positive) versus net exporters (negative), a key indicator of job/housing imbalance. The map below shows self-containment at the Census tract level for Baltimore City, where the pattern reflects the city’s mix of dense employment centers and residential neighborhoods with limited local job access.
# See data-raw/render_vignette_figures.R for the full figure code.
# Requires: ggplot2, sf, tigris, scales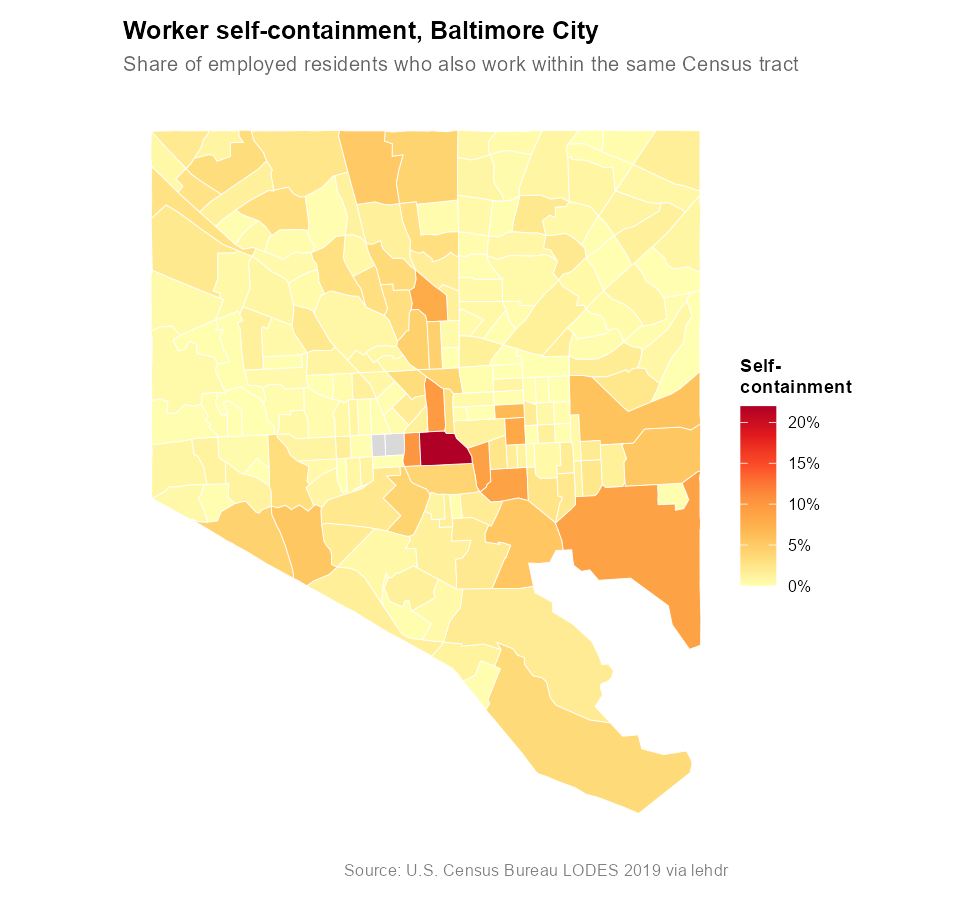
Longitudinal change
compute_lodes_change() computes absolute and percentage
change in any LODES variable between two years. The output can be wide
(one row per geography, with columns for each variable’s change) or long
(one row per geography-variable combination, suitable for
ggplot2).
wac_md_panel <- grab_lodes(
  state      = "md",
  year       = c(2010, 2019),
  lodes_type = "wac",
  job_type   = "JT00",
  segment    = "S000",
  agg_geo    = "county"
)

change_md <- compute_lodes_change(
  wac_md_panel,
  geo_col      = "w_county",
  base_year    = 2010,
  compare_year = 2019,
  variables    = c("C000", "CE01", "CE02", "CE03")
)

# Counties with the largest absolute job growth
change_md %>%
  arrange(desc(C000_change)) %>%
  select(w_county, C000_base, C000_compare, C000_change, C000_pct_change) %>%
  head(10)
The map below shows the percent change in total jobs
(C000) across Maryland counties from 2010 to 2019. The
diverging palette highlights counties that gained jobs (blue) versus
those that lost jobs (red) over the period.
# See data-raw/render_vignette_figures.R for the full figure code.
# Requires: ggplot2, sf, tigris, scales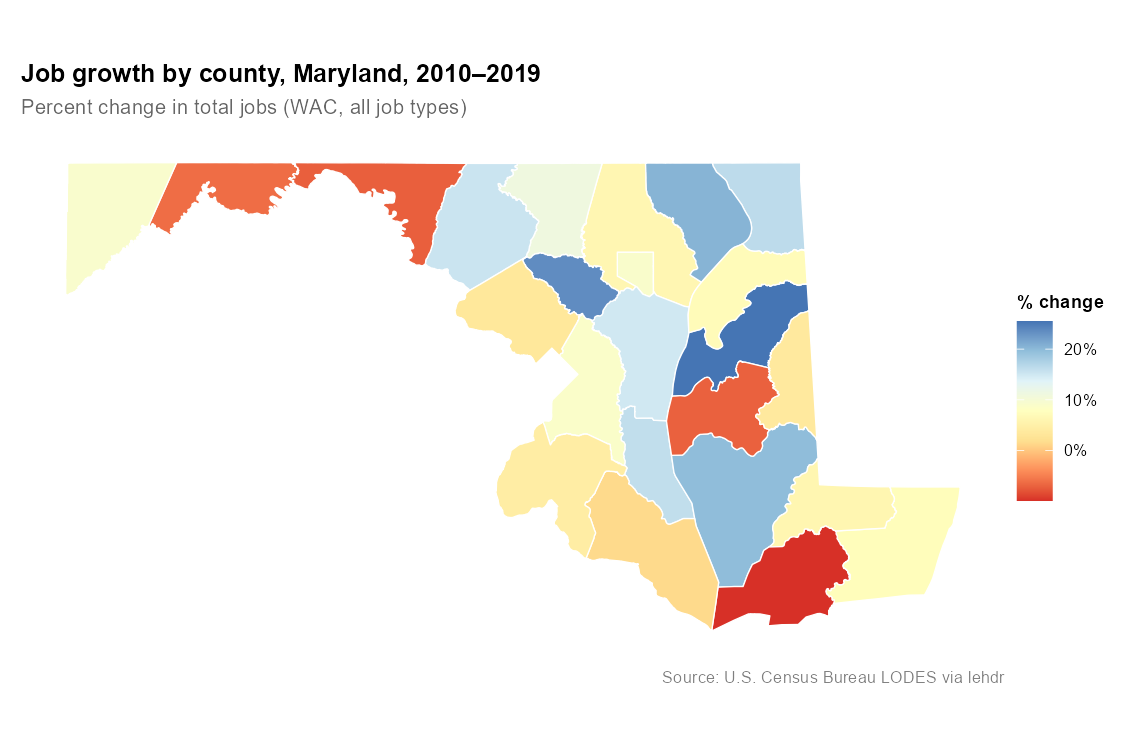
Long format is useful for visualizing change across multiple variables at once:
change_long <- compute_lodes_change(
  wac_md_panel,
  geo_col   = "w_county",
  output    = "long",
  variables = c("CE01", "CE02", "CE03")
)

# Suitable for use with ggplot2 facets or grouped geom_col()
head(change_long)
Earnings tier shares
compute_earnings_share() computes the distribution of
jobs (or resident workers) across three monthly earnings tiers defined
by LODES:
| Column | Tier | Monthly earnings |
|---|---|---|
CE01 |
Low | Up to $1,250 |
CE02 |
Mid | $1,251 to $3,333 |
CE03 |
High | Above $3,333 |
Both WAC and RAC files include these columns; type
controls only the geography prefix used for auto-detection
(w_ for WAC, h_ for RAC).
wac_md <- grab_lodes(
  state      = "md",
  year       = 2019,
  lodes_type = "wac",
  job_type   = "JT00",
  segment    = "S000",
  agg_geo    = "county"
)

earn_shares <- compute_earnings_share(wac_md, type = "wac", geo_col = "w_county")

# Counties with the highest share of low-wage jobs
earn_shares %>%
  arrange(desc(share_low)) %>%
  select(w_county, share_low, share_mid, share_high) %>%
  head(10)
Use output = "long" to get a format ready for stacked
bar charts:
earn_long <- compute_earnings_share(
  wac_md,
  type    = "wac",
  geo_col = "w_county",
  output  = "long"
)

head(earn_long)
The chart below shows the earnings tier composition for all Maryland counties in 2019, sorted by the share of low-wage jobs. Counties with a larger low-wage share tend to be more rural or tourism-dependent, while suburban counties closer to Washington, D.C. show higher shares of well-paid jobs.
# See data-raw/render_vignette_figures.R for the full figure code.
# Requires: ggplot2, tigris, scales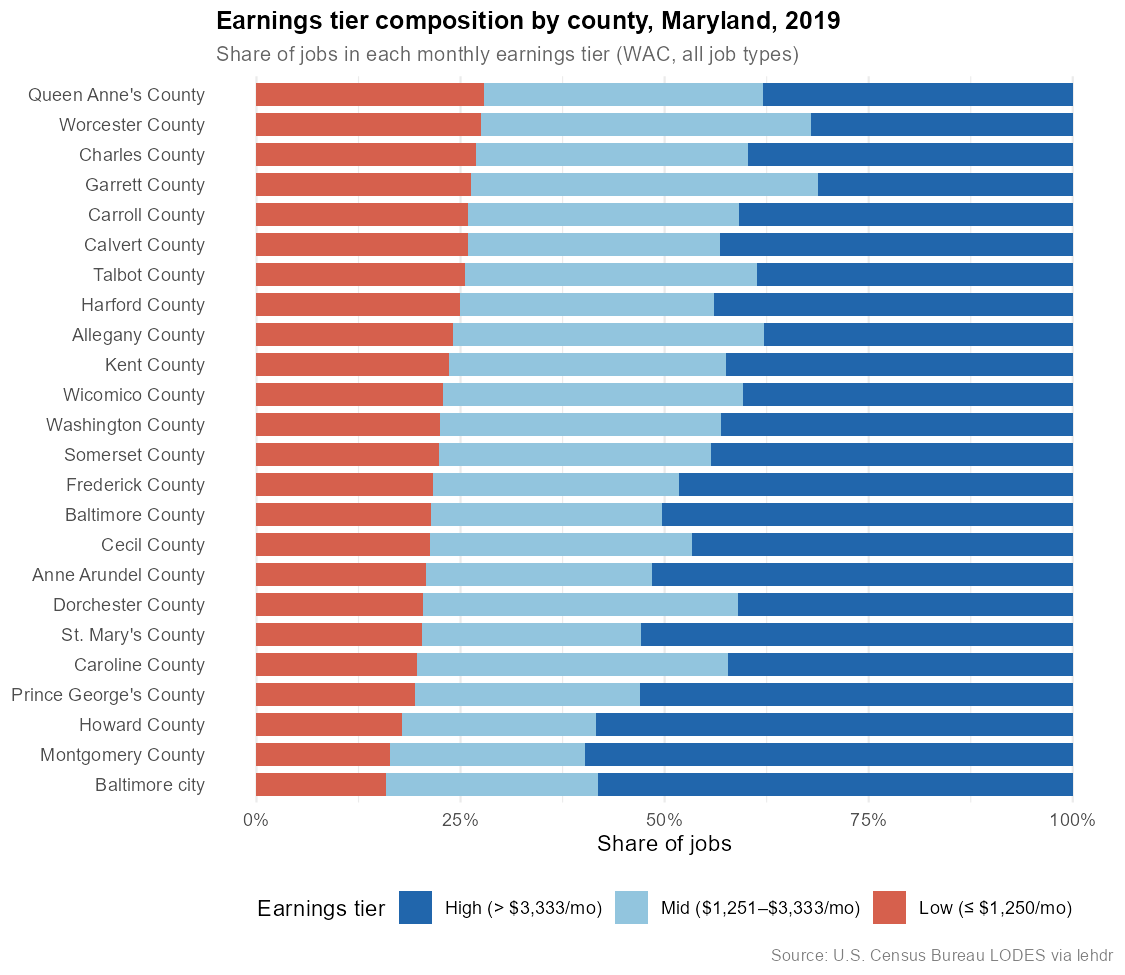
Combining compute_earnings_share() and
compute_lodes_change() supports longitudinal tracking of
wage polarization. Compute shares for each year separately, then join
and difference:
wac_panel <- grab_lodes(
  state      = "md",
  year       = c(2010, 2019),
  lodes_type = "wac",
  job_type   = "JT00",
  segment    = "S000",
  agg_geo    = "county"
)

share_2010 <- compute_earnings_share(
  dplyr::filter(wac_panel, year == 2010),
  type = "wac", geo_col = "w_county"
)

share_2019 <- compute_earnings_share(
  dplyr::filter(wac_panel, year == 2019),
  type = "wac", geo_col = "w_county"
)
Mapping LODES Data
The figures in this vignette were produced with ggplot2
and Census geometries from the tigris package. The general
pattern is:
- Download LODES data with
grab_lodes(). - Compute a derived variable with one of the analytical functions above.
- Fetch geometries with
tigris::tracts(),tigris::counties(), etc. - Join on the GEOID column and plot with
geom_sf().
The following example shows a simple flow-weighted job accessibility index for Baltimore City tracts. For each home tract, the metric sums the total number of workers flowing to all reachable work tracts — a proxy for labor market connectivity that can be computed entirely from LODES OD data.
od_md <- grab_lodes(
  state      = "md",
  year       = 2019,
  lodes_type = "od",
  job_type   = "JT00",
  segment    = "S000",
  state_part = "main",
  agg_geo    = "tract"
)

accessibility <- od_md %>%
  dplyr::filter(startsWith(h_tract, "24510")) %>%
  dplyr::group_by(h_tract) %>%
  dplyr::summarise(
    n_dest          = dplyr::n_distinct(w_tract),
    total_reachable = sum(S000, na.rm = TRUE),
    .groups         = "drop"
  )

head(accessibility)
n_dest captures the breadth of access (number of
distinct job destinations a tract sends workers to), while
total_reachable is a flow-weighted measure of aggregate
connectivity. A full accessibility analysis typically incorporates
travel times or distances (see packages such as r5r or
accessibility); the LODES-only measure here is a useful
starting point when network data are unavailable.
# See data-raw/render_vignette_figures.R for the full figure code.
# Requires: ggplot2, sf, tigris, scales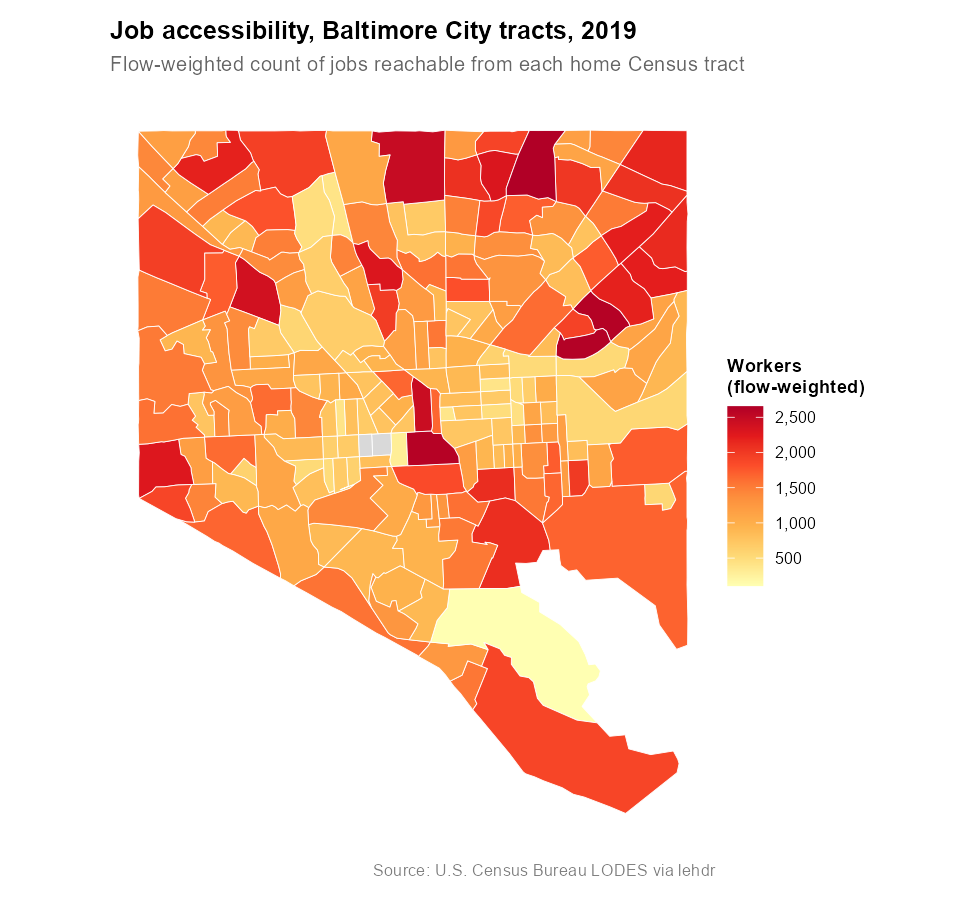
Caching
By default, downloaded files are deleted after reading. Setting
use_cache = TRUE retains files in the user-level cache
directory (tools::R_user_dir("lehdr", "cache")), which
avoids re-downloading when you call grab_lodes() repeatedly
with the same parameters. You can also set this option globally for a
session:
options(lehdr_use_cache = TRUE)The cache filename includes the LODES version (e.g.,
lodes8_md_wac_S000_JT00_2019.csv.gz), so switching between
LODES versions will not serve stale data from a different vintage.
Upgrading from lehdr < 1.2.0? Earlier versions
cached files without a version prefix (e.g.,
md_wac_S000_JT00_2019.csv.gz). Those files will never be
matched by the new naming scheme and can be safely deleted. To clear the
entire cache:
cache_dir <- tools::R_user_dir("lehdr", "cache")
list.files(cache_dir)          # inspect before deleting
unlink(cache_dir, recursive = TRUE)
Citation
If you use lehdr in published work, please cite it.
Running citation("lehdr") will return a BibTeX entry. In
Chicago author-date style:
Green, Jamaal, Liming Wang, and Dillon Mahmoudi. 2025. “lehdr: Grab Longitudinal Employer-Household Dynamics (LEHD) Flat Files.” R package version 1.2.0. https://github.com/jamgreen/lehdr/